Recently, microarray-based approaches for screening whole genome methylation status are available, and generate a great amount of data to establish a comprehensive view of whole genome methylation pattern. Nevertheless, an analytical online tool which focuses the methylation status around transcription start sites or promoter regions for these data is still lacked. Therefore, we developed DataBase of CpG Islands and Analytical Tools (DBCAT), which analyzes microarray data to identify methylation profile in the promoter regions.
DBCAT is composed of three parts: 1. CpG Island Finder, 2. Database Search, and 3. Methylation Microarray Analytical Tools. Each part provides information or functions for different purposes. The analytical tools can quickly identify genes with methylated regions from microarray data and provide functional analysis in addition to collation of transcription factor binding sites. In summary, DBCAT is a methylation database containing several convenient tools for investigating epigenetic regulation in some disease research.
CpG Island Finder
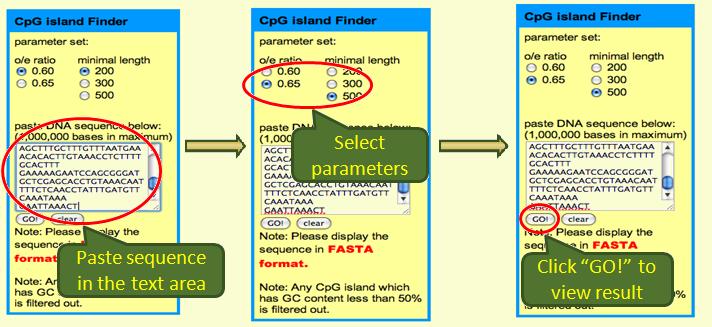
CpG Islands Finder is a tool for indentifying CpG Islands. The default setting of CpG Islands is based on Gardiner-Garden and Frommer's definiton. Basic criteria is a 200-bp of DNA with C+G content of 50% and ratio of observed CpG to expected CpG is greater than 0.6. Users simply input DNA sequence in FASTA format and determine the criteria stringency and will receive both text result and graphical result in return. The sequence would be useful when designing probes for methtylation spesific PCR(MSP) or bisulfite treated DNA sequencing.
To use CpG Island Finder is simple:
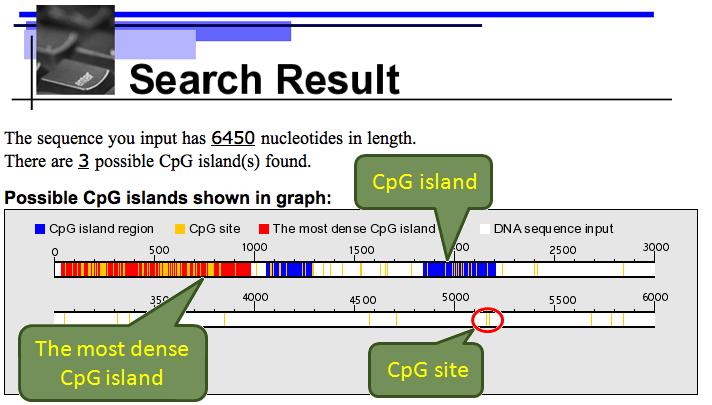
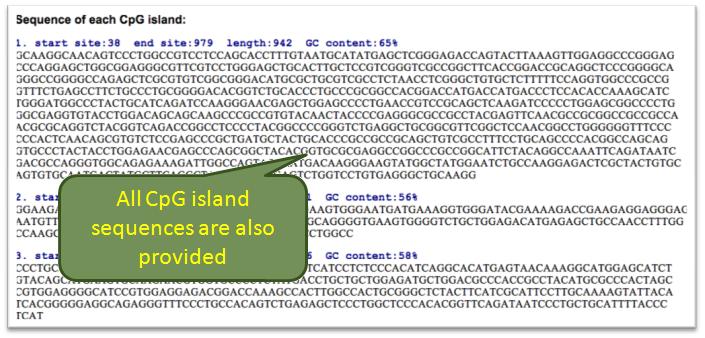
The graphical and text results are both shown:
Database Search
Human Genome Browser of CpG Islands
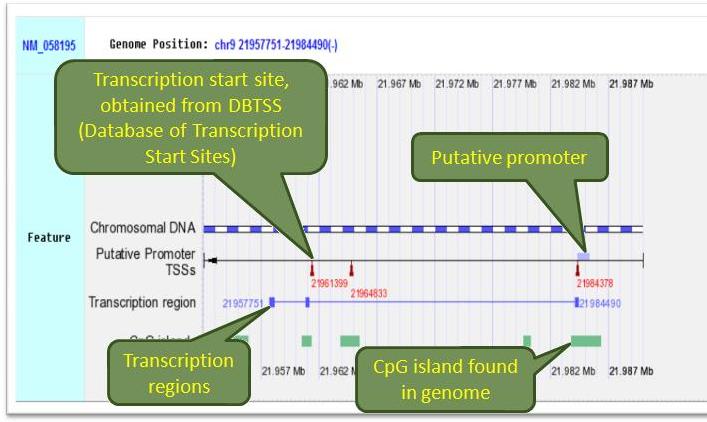
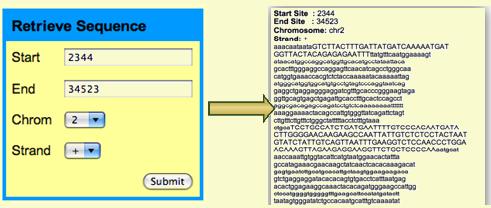
There are 3 query types provided in the human genome browser of CpG islands: 1. RefSeq ID, 2. Entrez GeneID, 3. gene symbol. The search results contain all CpG islands on human genome and other featured gene information including coding regions, transcription start sites(TSSs) and putative promoters. These are all graphically shown. The biological processes, molecular functions and KEGG pathways of each gene queried are also provided in text part. In addition, all colored boxes on the feature (transcription regions, CpG islands, putative promoters) can be "clicked" for retreiving sequences of those regions.
Retrieve Sequence
The reference sequence of human genome can also be easily retrieved:
Methylation Microarray Analytical Tools
Array Data Upload
Users are required to create their own accounts so that they can manage their own data. Before analysis, we need users to download an execution file to extract the essential parts from raw data, then the analysis could be performed after uploading the extracted file. This can help reduce time consumed when translating and calculating. Currently DBCAT is compatible with Agilent and Illumina formats and we provide two execution files for both.
Single Array Analysis
Uploaded project will be shown on the selection area. There are two jobs can be selected: 1. view scatter plot, 2. identify methylated genes. Scatter plot is for checking array quality and users should perform "get methylated genes list" to identify methylated genes. Before analysis, there are 3 parameters should be determined:
- minimal length of sliding window, l
- threshold of log2 ratio converted form probe intensity, r
- minimal numbers of probes contained in the sliding window, d
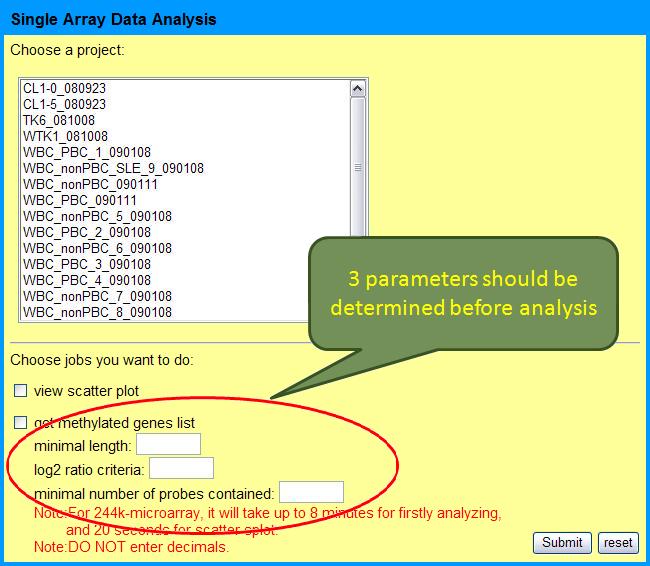
This is because we use sliding window approach to estimate the methylation status of genes. Here the methylated region is defined as a segment with length l, containing at least d probes and the proportion of the probes with log2 ratio larger than r is greater than 50%. These parameters are flexible for different array quality or array types. According to our experience, l=400, r=2 or 3 and d=3 for Agilent array and l=1000, r=3~5 and d=2 for Illumina array are often used, due to their different probe number and intensity.
It can take up to 8 minutes for a 244k-microarray to analyze. For saving time, all analyzed results will be imported into the database and users can quickly retreive the results anytime.
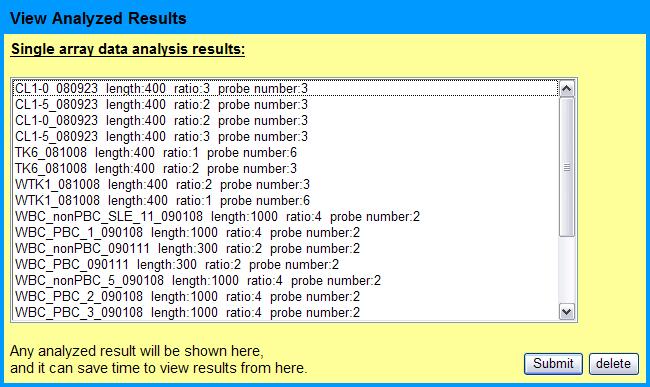
The results are displayed as below:
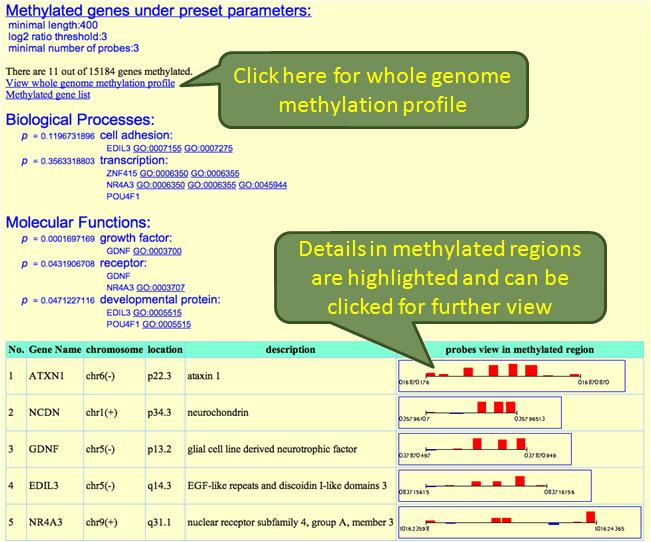
Genes meet the criteria set by user are sorted out and listed as a table. These genes are classified by their biological processes and molecular functions. The calculated p-values represent the enrichment of genes being affected by methylation.Those GO accession numbers can be clicked for more information in Gene Ontology. The gene list can be donwloaded by clicking "Methylated gene list". Methylation status of each gene is also dispayed and can be linked to a further detailed profile. An overview of whole genome methylation status is also provided:
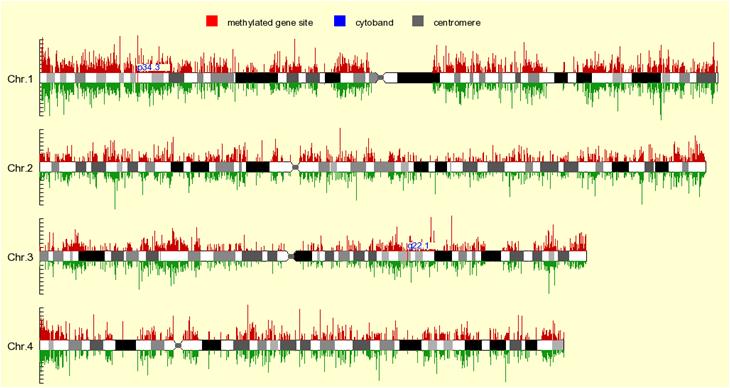
All areas on the graph can be clicked for enlarged view:

The red and green line above and under the chromosome represent red and green signals, respectively. Red area on the chromosome represents methylated region, and the location of cytoband is also shown.
Detailed profile of methylation region is shown as below:
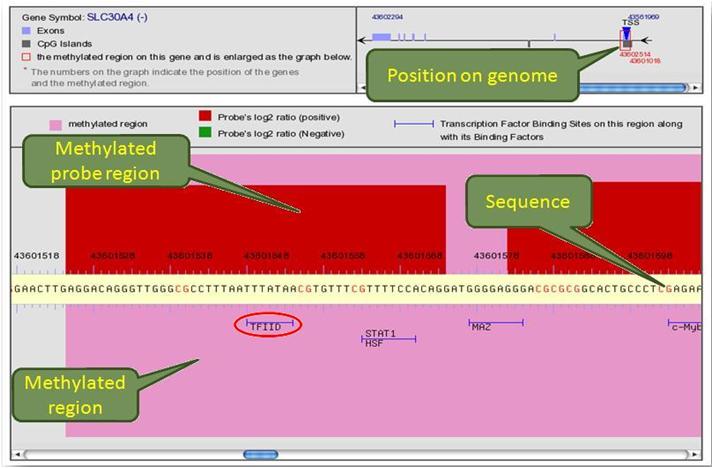
This detailed profile of methylation region is incorporated with TFBS. In this profile, the location of methylated region on genome is graphically shown. The sequence is collated with TFBS and matched transcription factor(TF) binding motives are marked with its corresponding TF. The red and pink areas represent probes and methylated regions, respectively.
Cross Array Comparison
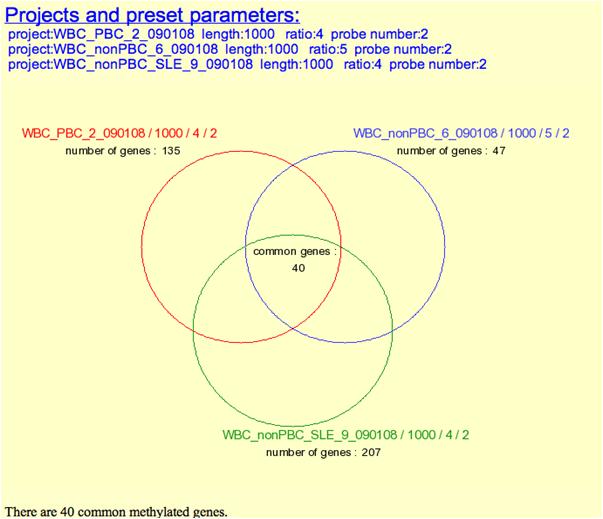
There are 3 jobs we can do in Cross Array Comparison: 1. View Box Plot 2. View Venn Diagram 3. Dynamic Changes Analysis. View Box Plot helps users to check the quality among different arrays with statistical data. View Venn Diagram provides users common methylated genes among different arrays. Dynamic Changes Analysis is a useful tool for users when they need to compare methylation status changes of the cells which were treated with different conditions.
Box Plot:

Venn Diagrm:
Dynamic Changes Analysis:
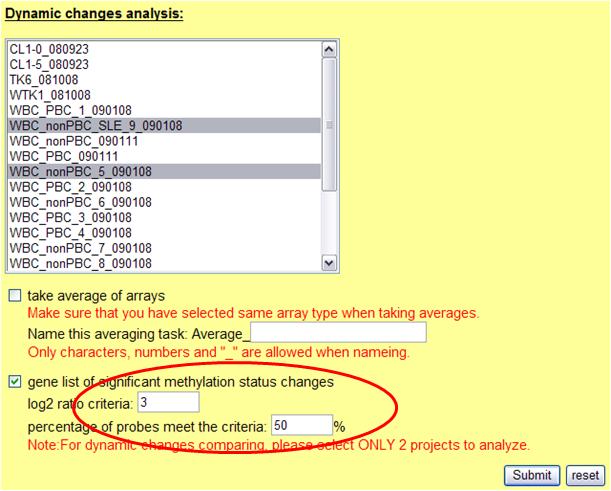
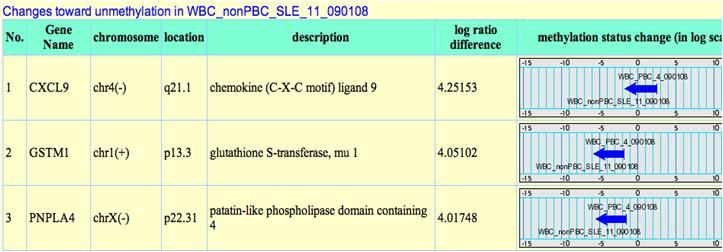
In addition to dynamic changes analysis between arrays, taking average of arrays are also provided. This is useful when users have repeated samples to be compared. Before analysis, 2 parameters need to be determined: 1. log2 ratio 2. percentage of probes meet determined log2 ratio. The system will identify genes which contain qualified number of probes with sufficient log2 ratio changes between 2 projects. The results are shown as below:
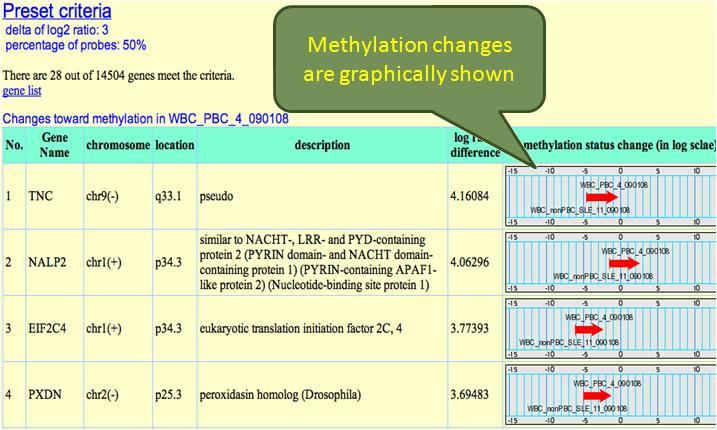
These genes are listed descendingly according to their methylation status changes. When we set one project to be basal, the arrow means the methylation change from basal to the other project. Changes toward the opposite direction are shown as blue arrows: